The steps below show how to access the debug console for a iOS8 device.
You will need:
- An iPad, iPod or iPhone
- A USB cable
- An Mac OS computer with Safari installed
Step 1 – Enable debug mode on the device
- Open the ‘Settings’ menu
- Scroll down until you see ‘Safari’ and click on it
- Under the Safari settings scroll down until you see ‘Advanced’ and click on it
- Enable ‘Web Inspector’
Step 2 – Connect the device to the Mac OS computer
- Using the USB cable, plug the device into your Mac OS computer.
Step 3 – Enable the debug tools in Safari
- On the Mac OS computer, open Safari
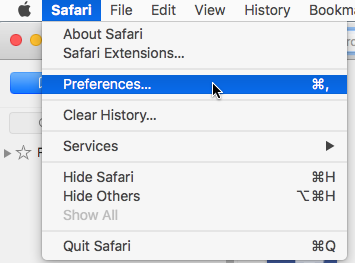
- Open the ‘Safari’ menu then click on ‘Preferences’
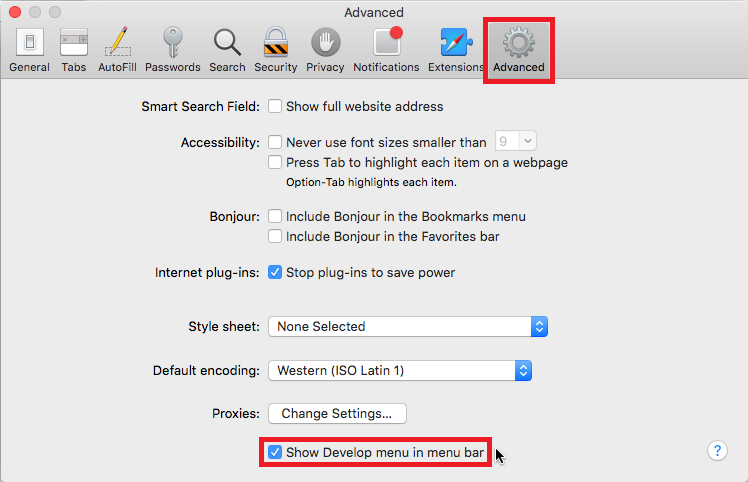
- Click on ‘Advanced’ in the toolbar then tick ‘Show Develop menu in the menu bar’
- Close the window.
Step 4 – Connect Safari to the device and launch the debug console
- On the iOS device – open Safari and go to the website you want to debug
- Open the ‘Develop’ menu
- In the menu you will see the name of your device, in this case it’s “iPad”
- Open the menu for your device then click on the address of the website
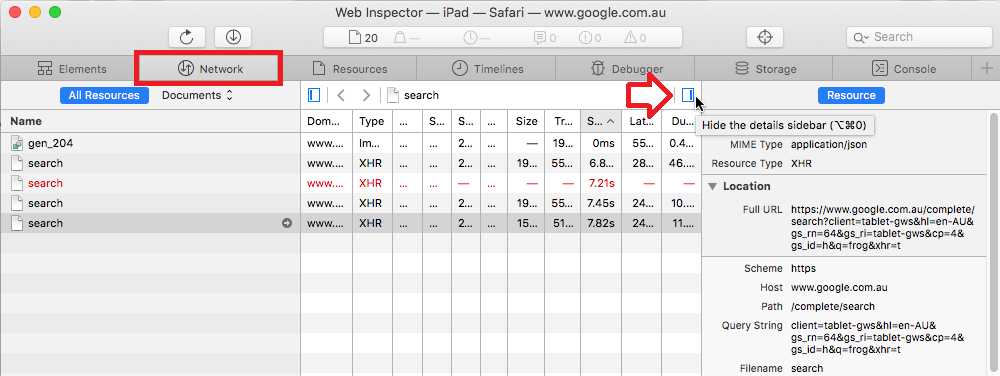
- The screen on the device will briefly flash and the “Web Inspector” window will open on the Mac OS computer
- Any browsing the website and background Ajax requests will now be captured in the Web Inspector
- Ajax requests will appear on the “Network” tab
- To view the details of the request, for example the header and post information, click on the button at the top right of the window
- Request errors and script errors will appear in the “Console” tab.


